
Diversity at Nash & Co Solicitors
The information below is a result of the diversity questionnaire that our staff filled out in July 2023. It easily demonstrates the information about the firm by population and diversity category
A breakdown of each of the roles of the staff who submitted their information.
Full Equity Solicitor Partners - 6%
Salaried or Partial Equity Solicitor Partners - 12%
Solicitors & Chartered Legal Executives - 28%
Other fee earners (Trainees and Paralegals) - 12%
Role directly supporting a fee earner - 26%
Business Services Managerial - 6%
Business Services Support - 8%
Prefer not to say - 2%

Role in the firm
Overwhelmingly, we are a firm with a large majority of female staff. 78% of our staff identify as female and the remaining 22% male.

Which gender do you identify with?

Gender breakdown as a % of all staff
The roles at the firm, split between those staff identifying as Female and as Male.
Full Equity Solicitor Partner - Male 75%, Female 25%
Salaried or Partial Equity Solicitor Partner - Male 50%, Female 50%
Solicitor (not Partner) - Male 6%, Female 94%
Other fee earning role - Male 37%, Female 63%
Role directly supporting a fee earner - Male 6%, Female 94%
Managerial role - Male 50%, Female 50%
IT / HR / Other corporate services role - Female 100%
Chartered Legal Executive - Female 100%
The ages of our staff, broken down into the following bands:
16-24 years old - 8%
25-34 years old - 22%
35 - 44 years old - 25%
45-54 years old - 18%
55-64 years old - 22%
65 + years old - 3%
Prefer not to say - 3%

Age distribution
Learn more about our promises to you as a client
Ethnicity

Ethnicity of the staff in the firm:
White - 94%
Black, Asian, Minority and other - 6%

Parental occupations
The distribution of religious beliefs across the firm:
No religion - 72%
Christian - 26%
Other religion or belief - 0%
Prefer not to say - 2%
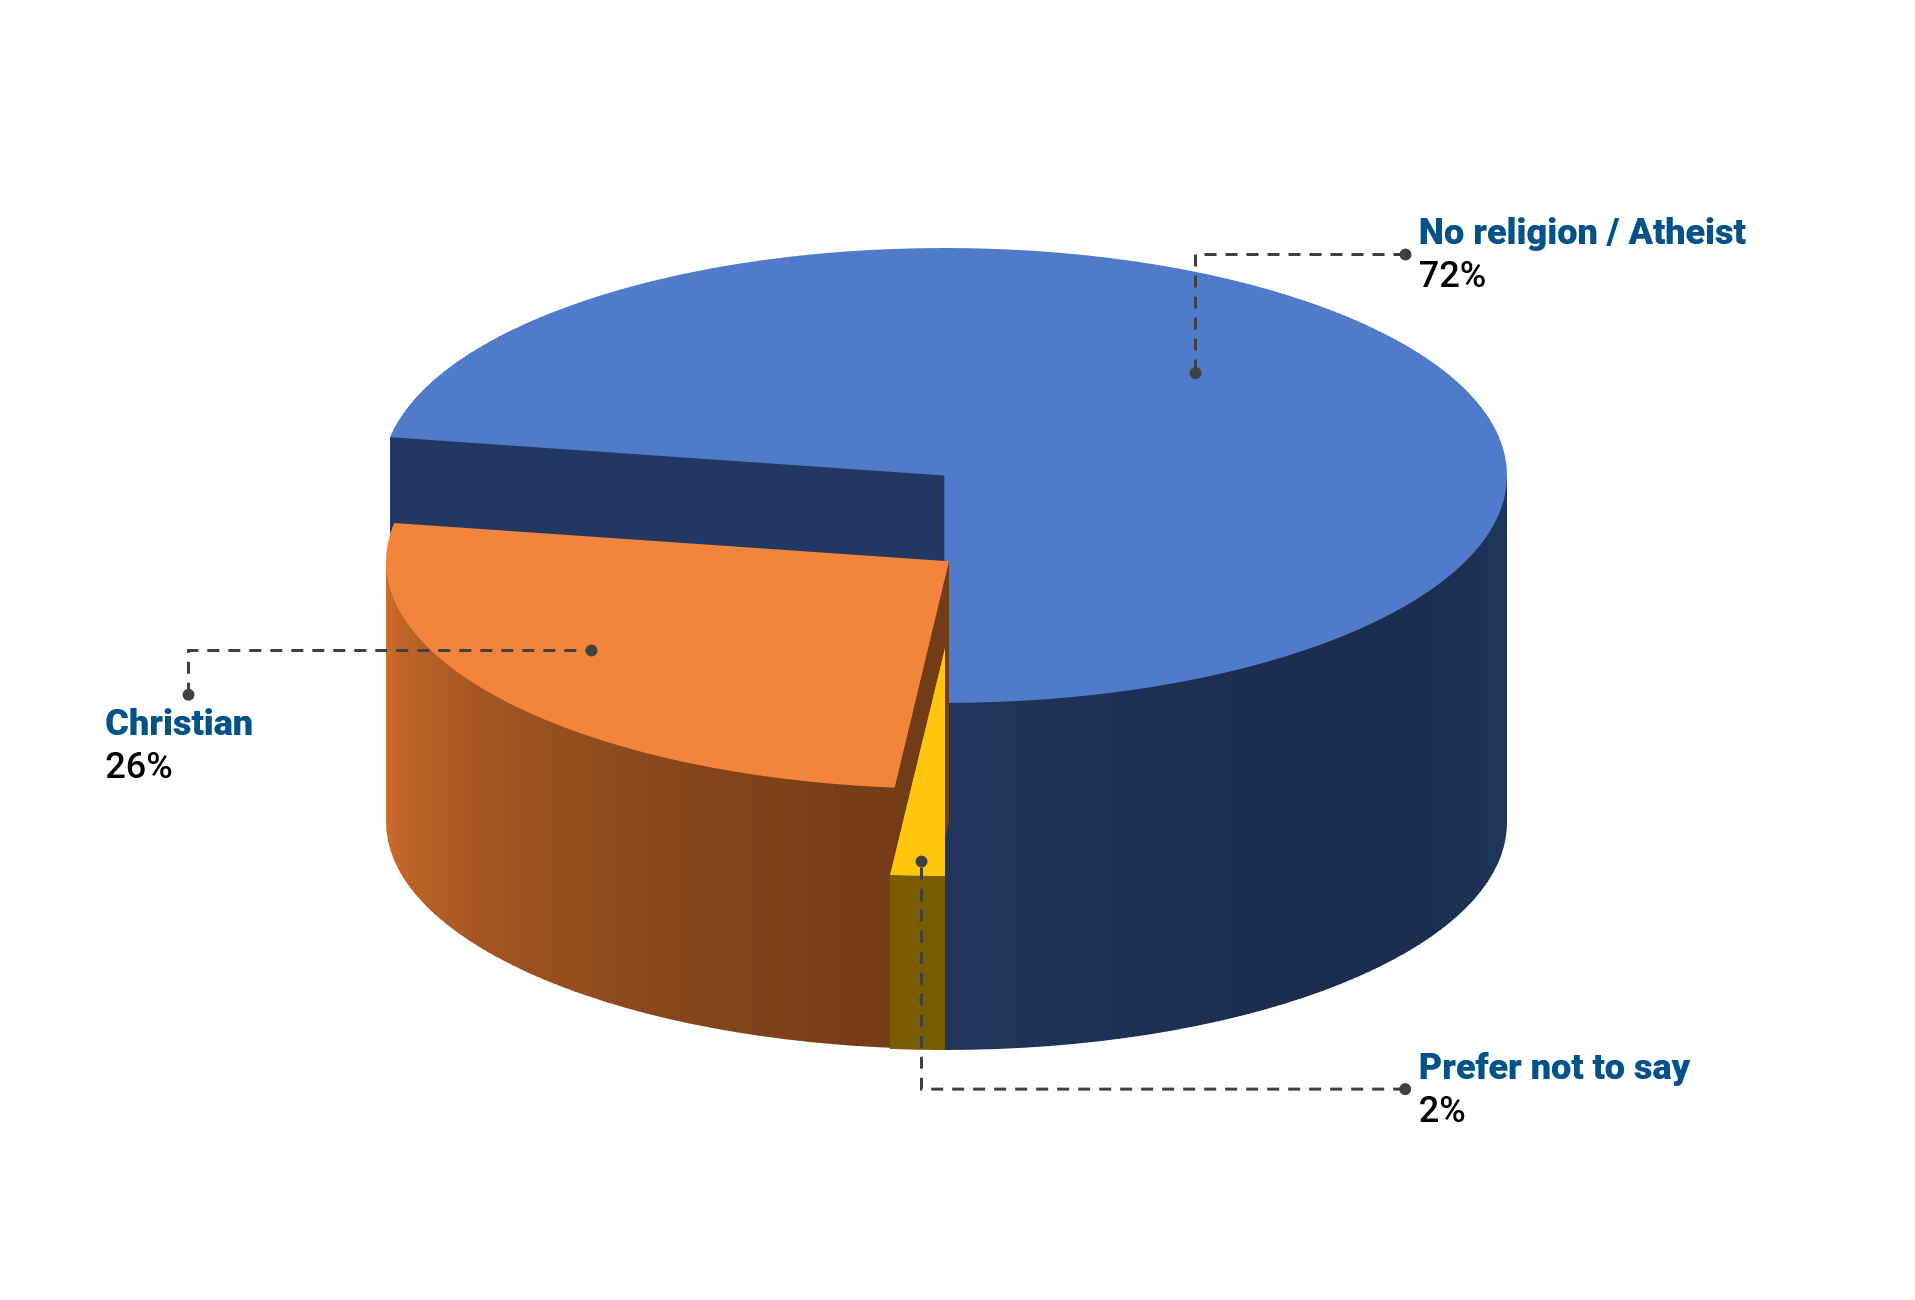
Religion
What kind of occupation did our staff’s parents have?
Professional - 42%
Intermediate - 18%
Lower socio economic background - 40%
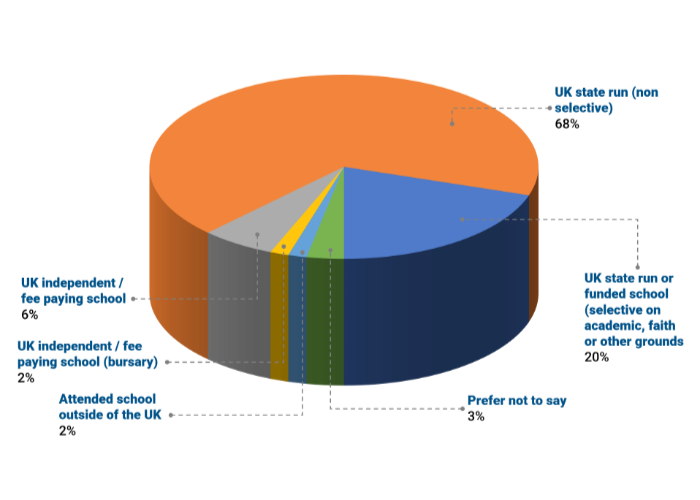
Type of school attended
What type of school did our staff attend?
UK state run (non selective) - 68%
UK state run or funded school (selective on academic, faith or other grounds) - 20%
UK independent / fee paying school - 6%
UK independent /fee paying school (bursary) - 2%
Attended school outside of the UK - 2%
Prefer not to say - 3%